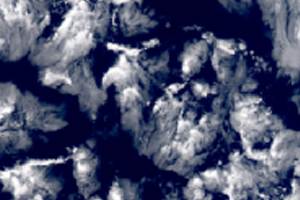

The above three images are from the same satellite image. Each has a different size, and all have been resized to the same size in the above image. One is approximately 112 km across, one is approximately 325 km across, and one is approximately 750 km across. Which is which?*
Moreover, why does this matter?
Strange weather–extreme events–generally involve a wide range of scales. Weather systems are often several hundreds of kilometers wide, but rain within them changes rapidly over a few kilometers. Doppler radar imagery that is prevalent on weather reports show this. One part of a city might have pouring rain while another part of a city has none.
Because of this wide range of scales, weather and climate models must be able simulate how the atmosphere moves at a wide range of scales in order to simulate strange weather. Weather and climate models divide the atmosphere into a bunch of relatively large `boxes’ (analogous to pixels in an image) and track the movement of wind, water, and energy among the boxes. The boxes in state-of-the-science global climate models are approximately 25 km across, and they must use a separate type of model (technically called a parameterization) to deal with what happens within these boxes. In order to do a good job at simulating strange weather, these parameterizations must take what is happen at large scales and translate them reliably into what is happening at the small scales at which strange weather occurs.
This is where self-similarity comes in.
Many aspects of the atmosphere are what we call `self-similar‘. The cloud images above illustrate this perfectly. The images are by no means identical, but they also aren’t very different. There is very little that distinguishes one image from another: despite one image being almost 10 times wider than another. This is the essence of self-similarity: the statistics at one scale are identical to the statistics at another. In the cloud image above, this means that if you look at the number of clouds that have 8 pixels and compare that to the number of clouds that have 67 pixels, the ratio of those two numbers will be about the same in each image!
In the CASCADE project, we are taking advantage of self-similarity to improve the way that weather and climate models connect the large scales to the small scales. If you know the statistics of the atmosphere at large scales, this tells you what the statistics should be at small scales. This also means that as we shrink the size of weather and climate model grid boxes, we know how the statistics of the atmosphere in these grid boxes should change. In some recent work, we used this knowledge to provide a detailed guide for how parameterizations of clouds should change as model grid boxes shrink.
We are actively working on developing a new type of cloud parameterization that takes advantage of this self-similarity. We look forward to blogging about this as we develop this idea further!
*Cloud image key: left (750 km), middle (325 km), right (112 km)