[av_one_third first min_height=” vertical_alignment=” space=” custom_margin=” margin=’0px’ link=” linktarget=” link_hover=” padding=’0px’ border=” border_color=” radius=’0px’ background=’bg_color’ background_color=” background_gradient_color1=” background_gradient_color2=” background_gradient_direction=’vertical’ src=” background_position=’top left’ background_repeat=’no-repeat’ animation=” mobile_breaking=” mobile_display=” av_uid=’av-16ihb1′]
[av_hr class=’custom’ height=’50’ shadow=’no-shadow’ position=’left’ custom_border=’av-border-fat’ custom_width=’50px’ custom_border_color=’#4467d0′ custom_margin_top=’0px’ custom_margin_bottom=’0px’ icon_select=’no’ custom_icon_color=” icon=’ue808′ font=’entypo-fontello’ av_uid=’av-jjssutd7′ admin_preview_bg=”]
[av_heading heading=’AUTHORS’ tag=’h3′ link_apply=” link=” link_target=” style=’blockquote modern-quote’ size=” subheading_active=’subheading_below’ subheading_size=’15’ margin=” padding=’10’ color=” custom_font=” custom_class=” admin_preview_bg=” av-desktop-hide=” av-medium-hide=” av-small-hide=” av-mini-hide=” av-medium-font-size-title=” av-small-font-size-title=” av-mini-font-size-title=” av-medium-font-size=” av-small-font-size=” av-mini-font-size=”]
Mark D. Risser and Michael F. Wehner
[/av_heading]
[av_heading heading=’YEAR’ tag=’h3′ link_apply=” link=” link_target=” style=’blockquote modern-quote’ size=” subheading_active=’subheading_below’ subheading_size=’15’ margin=” padding=’10’ color=” custom_font=” custom_class=” admin_preview_bg=” av-desktop-hide=” av-medium-hide=” av-small-hide=” av-mini-hide=” av-medium-font-size-title=” av-small-font-size-title=” av-mini-font-size-title=” av-medium-font-size=” av-small-font-size=” av-mini-font-size=”]
2017
[/av_heading]
[av_textblock size=” font_color=” color=” av-medium-font-size=” av-small-font-size=” av-mini-font-size=” av_uid=’av-jjxog1po’ admin_preview_bg=”]
DOI
[/av_textblock]
[av_hr class=’custom’ height=’50’ shadow=’no-shadow’ position=’left’ custom_border=’av-border-fat’ custom_width=’50px’ custom_border_color=’#4467d0′ custom_margin_top=’0px’ custom_margin_bottom=’0px’ icon_select=’no’ custom_icon_color=” icon=’ue808′ font=’entypo-fontello’ av_uid=’av-jjssutd7′ admin_preview_bg=”]
[/av_one_third][av_two_third min_height=” vertical_alignment=’av-align-top’ space=” margin=’0px’ margin_sync=’true’ link=” linktarget=” link_hover=” padding=’0px’ padding_sync=’true’ border=” border_color=” radius=’0px’ radius_sync=’true’ background=’bg_color’ background_color=” background_gradient_color1=” background_gradient_color2=” background_gradient_direction=’vertical’ src=” attachment=” attachment_size=” background_position=’top left’ background_repeat=’no-repeat’ animation=” mobile_breaking=” mobile_display=” av_uid=’av-wa9wl’]
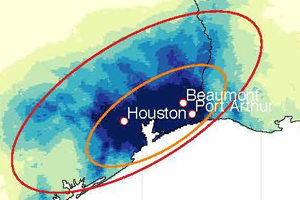
[av_heading heading=’Attributable Human‐Induced Changes in the Likelihood and Magnitude of the Observed Extreme Precipitation during Hurricane Harvey’ tag=’h3′ style=’blockquote modern-quote’ size=” subheading_active=’subheading_below’ subheading_size=’15’ margin=” margin_sync=’true’ padding=’10’ color=” custom_font=” av-medium-font-size-title=” av-small-font-size-title=” av-mini-font-size-title=” av-medium-font-size=” av-small-font-size=” av-mini-font-size=” av_uid=’av-jjxocm8o’ admin_preview_bg=”][/av_heading]
[av_image src=’http://climatemulti.wpengine.com/wp-content/uploads/sites/22/2018/07/stormTotals_2017-1-1-300×141.jpg’ attachment=’667′ attachment_size=’medium’ align=’center’ styling=” hover=” link=” target=” caption=” font_size=” appearance=” overlay_opacity=’0.4′ overlay_color=’#000000′ overlay_text_color=’#ffffff’ copyright=” animation=’no-animation’ av_uid=’av-9tzwy’ admin_preview_bg=”][/av_image]
[av_heading heading=’Abstract’ tag=’h3′ style=’blockquote modern-quote’ size=” subheading_active=’subheading_below’ subheading_size=’15’ margin=” margin_sync=’true’ padding=’10’ color=” custom_font=” av-medium-font-size-title=” av-small-font-size-title=” av-mini-font-size-title=” av-medium-font-size=” av-small-font-size=” av-mini-font-size=” av_uid=’av-jjxob4a9′ admin_preview_bg=”][/av_heading]
[av_textblock size=” font_color=” color=” av-medium-font-size=” av-small-font-size=” av-mini-font-size=” av_uid=’av-jjst1fu9′ admin_preview_bg=”]
Record rainfall amounts were recorded during Hurricane Harvey in the Houston, Texas, area, leading to widespread flooding. We analyze observed precipitation from the Global Historical Climatology Network with a covariate‐based extreme value statistical analysis, accounting for both the external influence of global warming and the internal influence of El Niño–Southern Oscillation. We find that human‐induced climate change likely increased the chances of the observed precipitation accumulations during Hurricane Harvey in the most affected areas of Houston by a factor of at least 3.5. Further, precipitation accumulations in these areas were likely increased by at least 18.8% (best estimate of 37.7%), which is larger than the 6–7% associated with an attributable warming of 1°C in the Gulf of Mexico and Clausius‐Clapeyron scaling. In a Granger causality sense, these statements provide lower bounds on the impact of climate change and motivate further attribution studies using dynamical climate models.
[/av_textblock]
[/av_two_third]