[av_one_third first min_height=” vertical_alignment=” space=” custom_margin=” margin=’0px’ link=” linktarget=” link_hover=” padding=’0px’ border=” border_color=” radius=’0px’ background=’bg_color’ background_color=” background_gradient_color1=” background_gradient_color2=” background_gradient_direction=’vertical’ src=” background_position=’top left’ background_repeat=’no-repeat’ animation=” mobile_breaking=” mobile_display=” av_uid=’av-16ihb1′]

[av_hr class=’custom’ height=’50’ shadow=’no-shadow’ position=’left’ custom_border=’av-border-fat’ custom_width=’50px’ custom_border_color=’#fdba2a’ custom_margin_top=’30px’ custom_margin_bottom=’30px’ icon_select=’no’ custom_icon_color=” icon=’ue808′ font=’entypo-fontello’ av_uid=’av-jjssutd7′ admin_preview_bg=”]

[av_heading heading=’AUTHORS’ tag=’h3′ link_apply=” link=’manually,http://’ link_target=” style=’blockquote modern-quote’ size=” subheading_active=’subheading_below’ subheading_size=’15’ margin=” padding=’10’ color=” custom_font=” custom_class=” admin_preview_bg=” av-desktop-hide=” av-medium-hide=” av-small-hide=” av-mini-hide=” av-medium-font-size-title=” av-small-font-size-title=” av-mini-font-size-title=” av-medium-font-size=” av-small-font-size=” av-mini-font-size=”]
Mark D. Risser, Christopher J. Paciorek, Michael F. Wehner, Travis A. O’Brien and William D. Collins
[/av_heading]

[av_heading heading=’YEAR’ tag=’h3′ link_apply=” link=’manually,http://’ link_target=” style=’blockquote modern-quote’ size=” subheading_active=’subheading_below’ subheading_size=’15’ margin=” padding=’10’ color=” custom_font=” custom_class=” admin_preview_bg=” av-desktop-hide=” av-medium-hide=” av-small-hide=” av-mini-hide=” av-medium-font-size-title=” av-small-font-size-title=” av-mini-font-size-title=” av-medium-font-size=” av-small-font-size=” av-mini-font-size=”]
February 2019
[/av_heading]

[av_textblock size=” font_color=” color=” av-medium-font-size=” av-small-font-size=” av-mini-font-size=” av_uid=’av-khmevium’ admin_preview_bg=”]
DOI
[/av_textblock]

[av_hr class=’custom’ height=’50’ shadow=’no-shadow’ position=’left’ custom_border=’av-border-fat’ custom_width=’50px’ custom_border_color=’#fdba2a’ custom_margin_top=’30px’ custom_margin_bottom=’30px’ icon_select=’no’ custom_icon_color=” icon=’ue808′ font=’entypo-fontello’ av_uid=’av-jjssutd7′ admin_preview_bg=”]

[/av_one_third][av_two_third min_height=” vertical_alignment=’av-align-top’ space=” margin=’0px’ margin_sync=’true’ link=” linktarget=” link_hover=” padding=’0px’ padding_sync=’true’ border=” border_color=” radius=’0px’ radius_sync=’true’ background=’bg_color’ background_color=” background_gradient_color1=” background_gradient_color2=” background_gradient_direction=’vertical’ src=” attachment=” attachment_size=” background_position=’top left’ background_repeat=’no-repeat’ animation=” mobile_breaking=” mobile_display=” av_uid=’av-wa9wl’]

[av_heading heading=’A probabilistic gridded product for daily precipitation extremes over the United States’ tag=’h3′ link_apply=” link=’manually,http://’ link_target=” style=’blockquote modern-quote’ size=” subheading_active=’subheading_below’ subheading_size=’15’ margin=” padding=’10’ color=” custom_font=” custom_class=” admin_preview_bg=” av-desktop-hide=” av-medium-hide=” av-small-hide=” av-mini-hide=” av-medium-font-size-title=” av-small-font-size-title=” av-mini-font-size-title=” av-medium-font-size=” av-small-font-size=” av-mini-font-size=”][/av_heading]

[av_image src=’http://climatemulti.wpengine.com/wp-content/uploads/sites/22/2020/11/Screen-Shot-2020-11-23-at-5.44.04-PM-300×230.png’ attachment=’3578′ attachment_size=’medium’ align=’center’ styling=” hover=” link=” target=” caption=” font_size=” appearance=” overlay_opacity=’0.4′ overlay_color=’#000000′ overlay_text_color=’#ffffff’ copyright=” animation=’no-animation’ av_uid=’av-9tzwy’ admin_preview_bg=”][/av_image]

[av_heading heading=’Abstract’ tag=’h3′ link_apply=” link=” link_target=” style=’blockquote modern-quote’ size=” subheading_active=’subheading_below’ subheading_size=’15’ margin=” padding=’10’ color=” custom_font=” custom_class=” admin_preview_bg=” av-desktop-hide=” av-medium-hide=” av-small-hide=” av-mini-hide=” av-medium-font-size-title=” av-small-font-size-title=” av-mini-font-size-title=” av-medium-font-size=” av-small-font-size=” av-mini-font-size=”][/av_heading]

[av_textblock size=” font_color=” color=” av-medium-font-size=” av-small-font-size=” av-mini-font-size=” av_uid=’av-jjst1fu9′ admin_preview_bg=”]
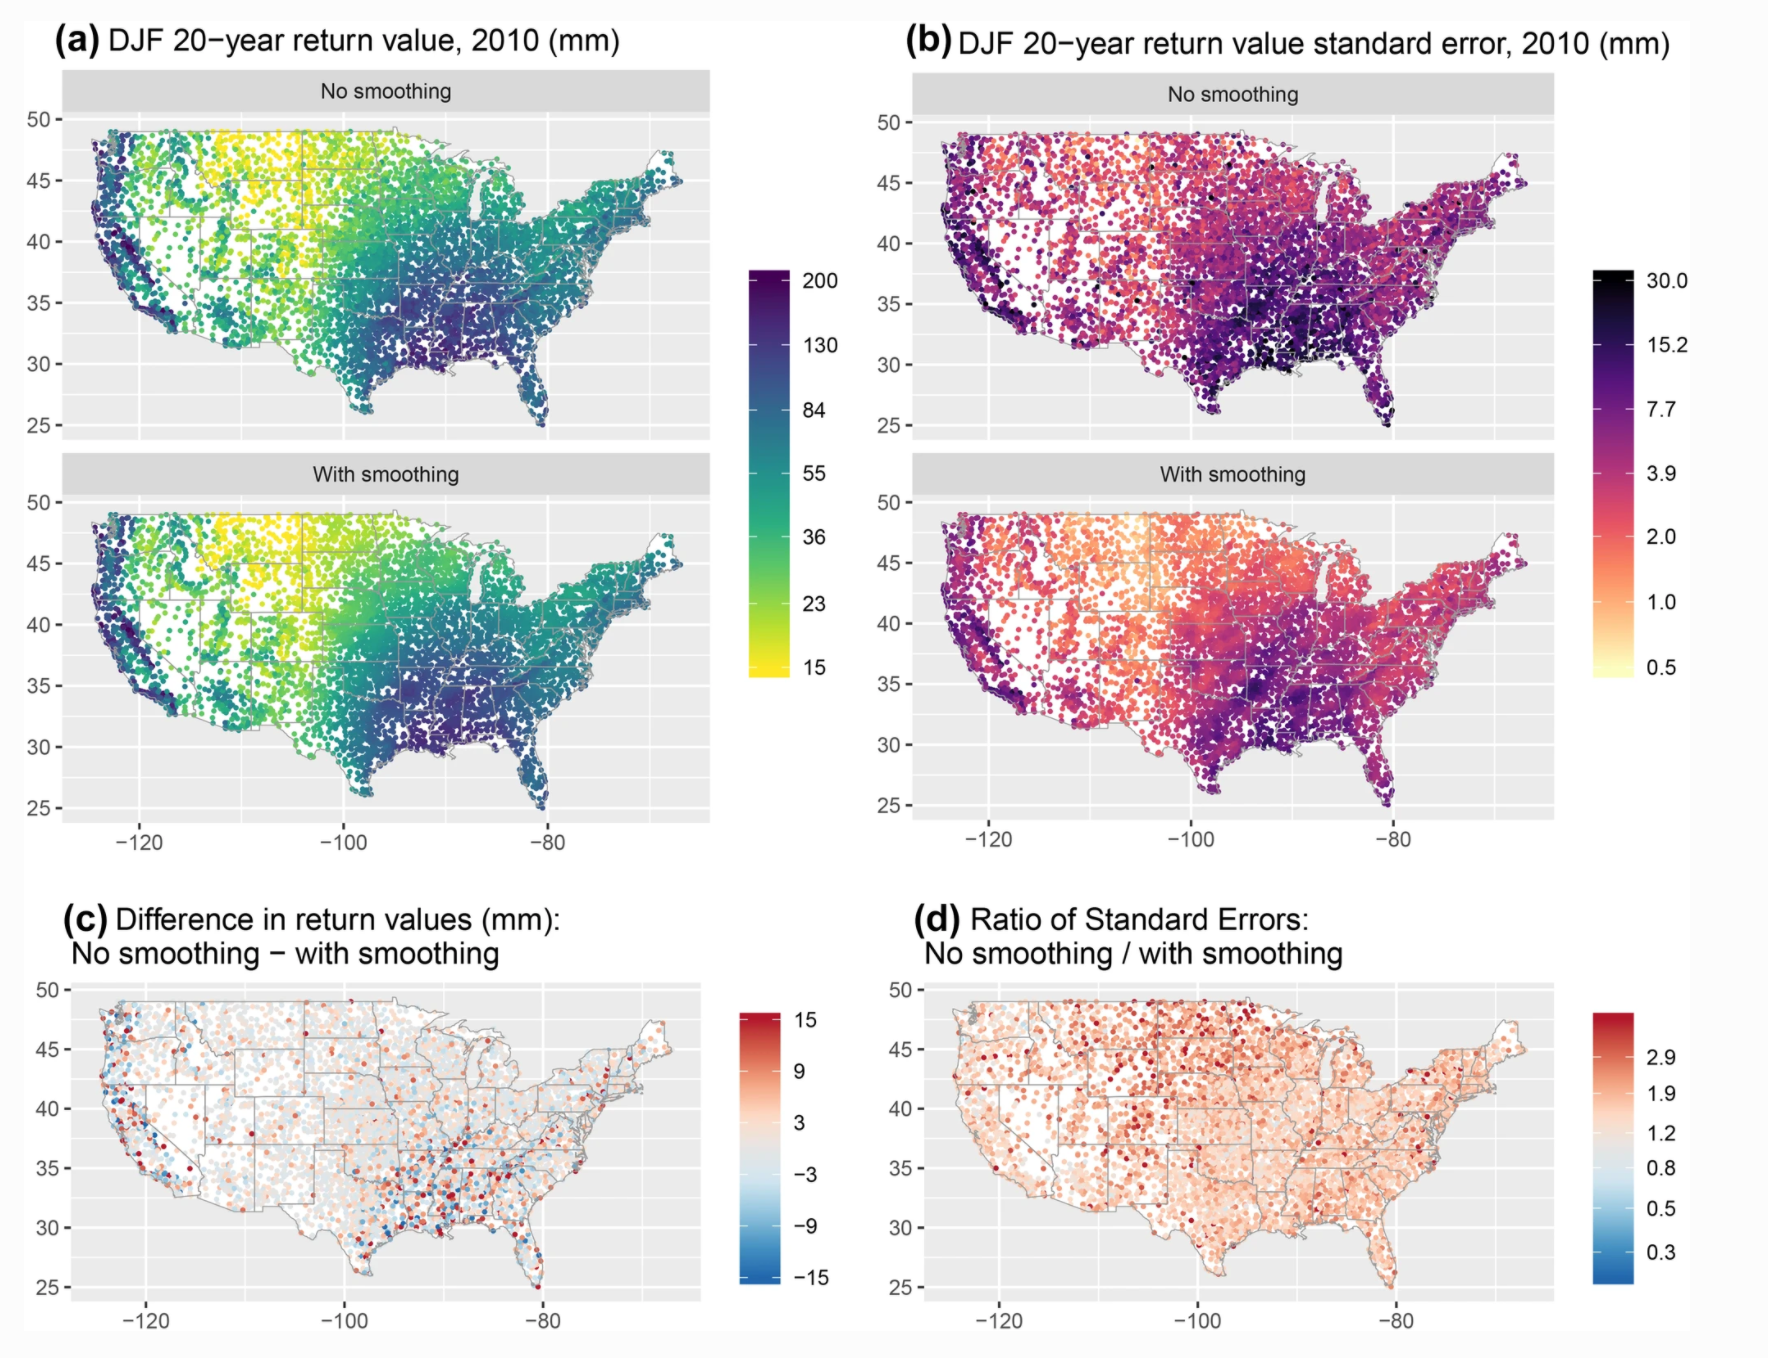
Gridded data products, for example interpolated daily measurements of precipitation from weather stations, are commonly used as a convenient substitute for direct observations because these products provide a spatially and temporally continuous and complete source of data. However, when the goal is to characterize climatological features of extreme precipitation over a spatial domain (e.g., a map of return values) at the native spatial scales of these phenomena, then gridded products may lead to incorrect conclusions because daily precipitation is a fractal field and hence any smoothing technique will dampen local extremes. To address this issue, we create a new “probabilistic” gridded product specifically designed to characterize the climatological properties of extreme precipitation by applying spatial statistical analysis to daily measurements of precipitation from the Global Historical Climatology Network over the contiguous United States. The essence of our method is to first estimate the climatology of extreme precipitation based on station data and then use a data-driven statistical approach to interpolate these estimates to a fine grid. We argue that our method yields an improved characterization of the climatology within a grid cell because the probabilistic behavior of extreme precipitation is much better behaved (i.e., smoother) than daily weather. Furthermore, the spatial smoothing innate to our approach significantly increases the signal-to-noise ratio in the estimated extreme statistics relative to an analysis without smoothing. Finally, by deriving a data-driven approach for translating extreme statistics to a spatially complete grid, the methodology outlined in this paper resolves the issue of how to properly compare station data with output from earth system models. We conclude the paper by comparing our probabilistic gridded product with a standard extreme value analysis of the Livneh gridded daily precipitation product. Our new data product is freely available on the Harvard Dataverse (https://bit.ly/2CXdnuj).
[/av_textblock]

[/av_two_third]